Market Depth Chart: Determine Liquidity

One of the most important things in cryptocurrency trading is understanding the demand and supply of a specific asset. The depth chart is a great method to understand how many buy and sell orders are carried out. This is a visual diagram that illustrates the supply and demand. Let’s describe this in detail.
What is market depth?
The most important term associated with our topic is market depth. This is a number of pending orders that were created by users. The bigger this number, the lower your chances to affect the prices. The one huge order can change the prices very quickly if the market depth is low.
You might ask a question: Why do I have to know what the depth chart is? Most people don’t have so much money to make such a big order. The reason is very easy to understand. If there was some person that had such a large amount of money, what impact would they make the market? If there was a huge number of pending orders, the very rich traders wouldn’t be able to affect the market significantly. You can predict the potential volatility using the market depth.
The depth chart is a very popular cryptocurrency instrument, but it isn’t so suitable for other assets. Also, you should understand that the cryptocurrency market isn’t regulated. for this reason, you can come across a fake.
You should understand that this type of technical indicator isn’t very reliable because of the reason above. You need to use other instruments of the technical analysis to understand the market clearly.
One more reason why you need to analyze market depth is the buy and sell walls. If there are too few pending orders, one person with a huge amount of money can open a big order, creating an attractive price for other people, but they cancel these orders the moment before opening at a good price.
This is easy to understand via a real example. For example, you want to sell 10 Bitcoins. You see a big wall on the market and you expect a great order. However, after opening the order, this wall is closed immediately. As a result, you sell Bitcoin at a bad price.
This situation is unusual in regulated markets. For example, this situation is almost impossible in the stock market. You can be punished if you open a huge pending order and cancel it. This operation is called “spoofing”.
If you cancel small pending orders, this is a normal situation. However, canceling huge orders is associated with dishonest actions in the opinion of other traders. The reasons are easy to understand, with the low depth of the market any significant order can change the alignment of forces.
However, cryptocurrencies aren’t regulated at all. For this reason, there are a lot of additional troubles that make this type of digital assets riskier.
How to understand the depth chart?
In this picture, you can see an example of the depth chart.
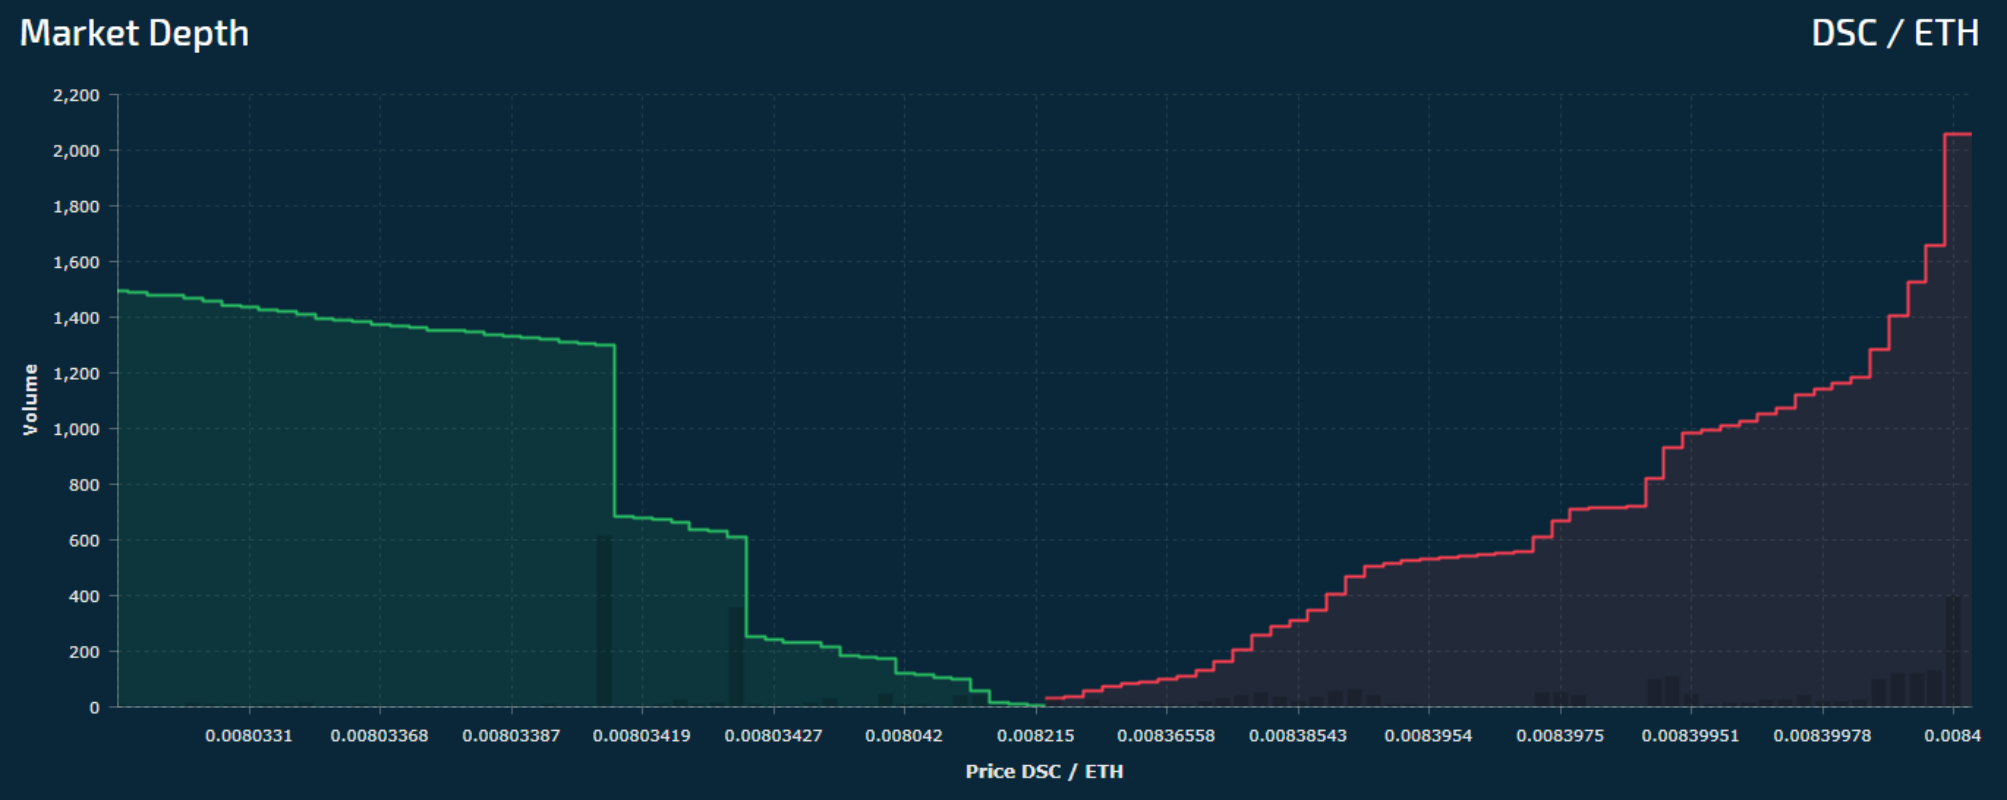
On the left side, we see the buy orders and on the right, we see the sell orders. Usually, the first are displayed via green lines on the diagram, and the second are displayed via red lines.
The price is variable if we have a huge demand and wide supply. In the best case, values are not far one from one. Yet, in real life, these fluctuations happen in all cases if we talk about cryptocurrencies or other volatile assets.
This is easy to understand with an example. Imagine that you want to purchase 10 apples. Each costs $1 and on the graph along the x-axis, we will see an order with this data. The order to buy the 10 apples will be demonstrated on the y-axis. After that, you can sell apples at 1,10 dollars for each. It will be demonstrated as a point on the right.
With liquid assets, the depth chart is like a picture in the mirror. However, if supply and demand are not in balance, the graph looks like this screenshot.
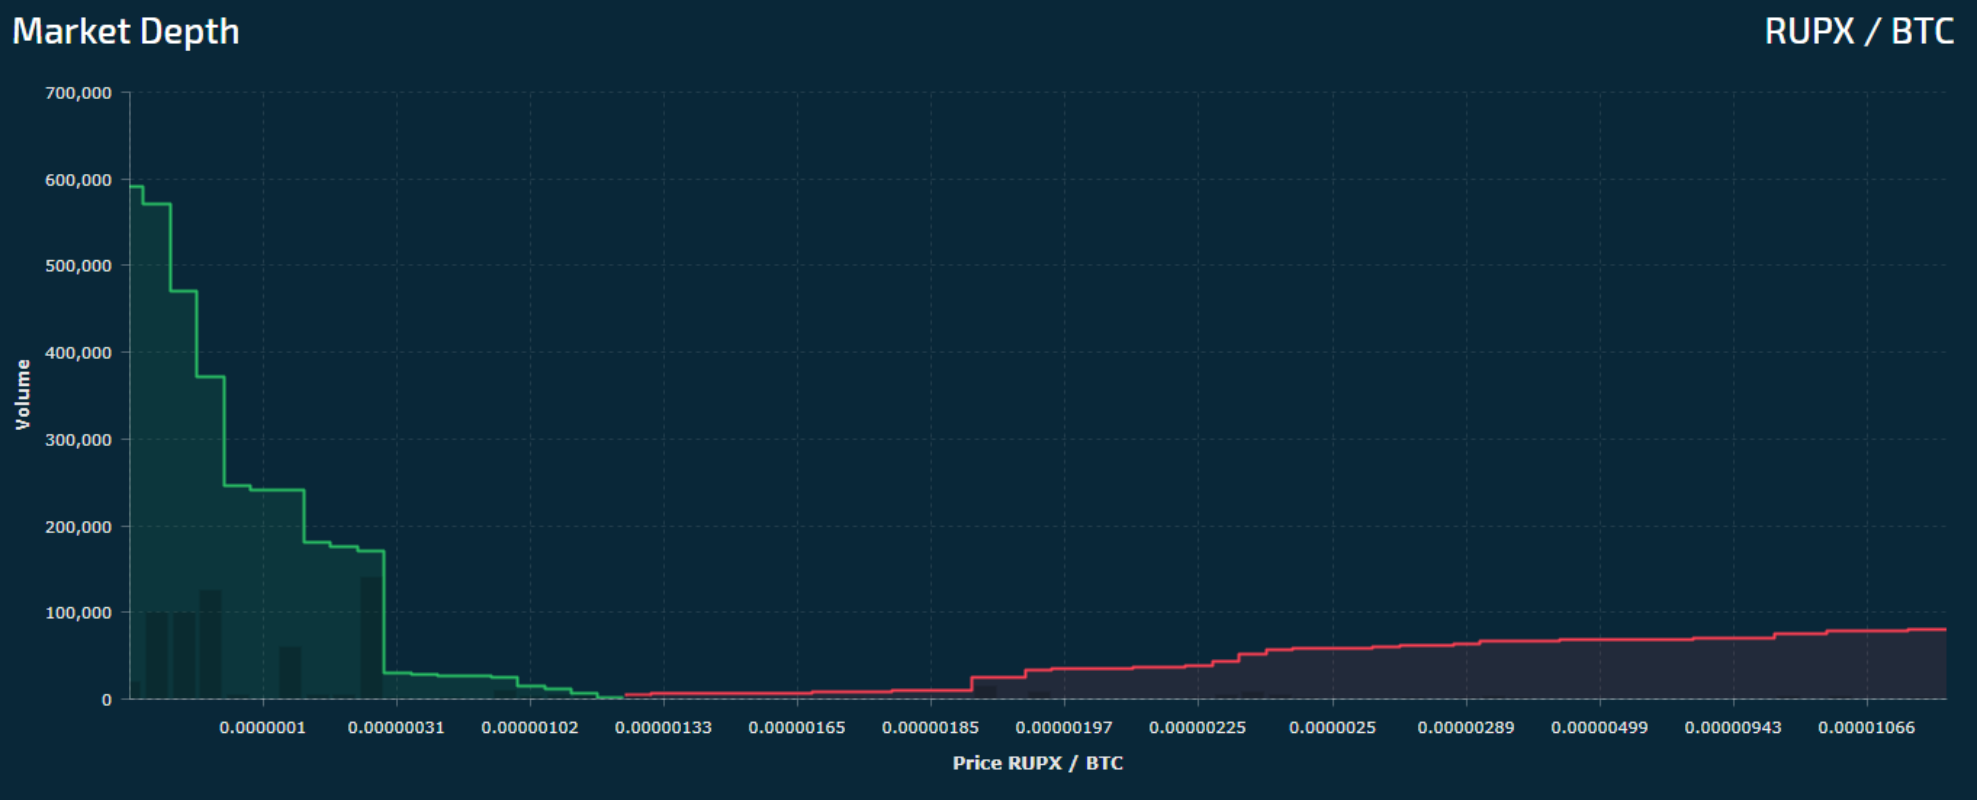
There are these graph characteristics with unprofitable assets:
- Values that are on the x-axis are placed too wide. It means that a certain price isn’t interesting for the traders.
- An uneven demand on this diagram. It means that a certain asset is volatile and risky.
The last situation is very usual for cryptocurrencies. We can see the simple diagram with prices at different times and understand how changeable cryptocurrency is.
Every volatile asset is both full of opportunities and risks. The higher the potential profit is, the higher risks are. This is a rule for every investment.
A lot of people say that any cryptocurrency isn’t reliable for investments. However, this statement is false because you need to have some qualifications. You are not supposed to trade cryptocurrencies if you don’t know how to trade less volatile assets, such as stocks.
Also, you need to create your investment portfolio. What is it? An investment portfolio is a great method to diversify your investments and make them less risky. These investments are spread between different assets. You need to have both profitable and stable assets.
Also, we can’t say that cryptocurrency trading isn’t profitable and stable at all. There are a lot of stable coins that are connected with fiat money and keep all the advantages that classic cryptocurrencies have.
Cryptocurrency prospects are optimistic. According to the information given by the specialists, the number of wallets will be increased from 200 million to 2030.
Market depth is going to be a great instrument to decrease risks of this controversial asset and increase profitability.